Interactive Charts with Open Source JavaScript Library
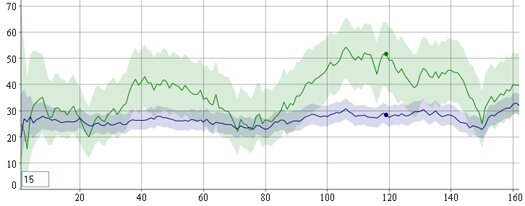
dygraphs is an open source JavaScript library that produces produces interactive, zoomable charts of time series. It is designed to display dense data sets and enable users to explore and interpret them.

This Open Source JavaScript Charts Library is purely client-side JavaScript. It does not send your data to any servers – the data is processed entirely in the client’s browser.
The dygraphs JavaScript library relies heavily on HTML’s <canvas> tag, which Microsoft Internet Explorer does not support. Fortunately, some clever engineers created the excanvas library, which implements the <canvas> tag in IE using VML.
Free JavaScript Charting Library Features
- Plots time series without using an external server or Flash
- Displays values on mouseover
- Supports error bands around data series
- Interactive zoom
- Adjustable averaging period
- Can intelligently chart fractions
- Compatible with the Google Visualization API
This Open Source JavaScript Charting Library is lightweight and has ability to display error bars around data series.
Website: http://www.danvk.org/dygraphs/

Recent Comments