Visualization Toolkit For Javascript Using Canvas – Protovis
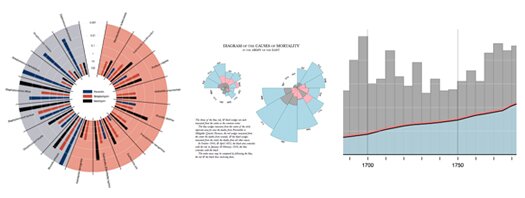
Protovis is a Visualization Toolkit for JavaScript using the canvas element. It takes a graphical approach to data visualization, composing custom views of data with simple graphical primitives like bars and dots. These primitives are called marks, and each mark encodes data visually through dynamic properties such as color and position.

Website: http://vis.stanford.edu/protovis/
Demo: http://vis.stanford.edu/protovis/ex/
Download: http://code.google.com/p/protovis-js/downloads/list
Ugh, I liked! So clear and positively.
Hello,
Ugh, I liked! So clear and positively.
Have a nice day