Apr
HTML5 JavaScript Charting Library: RGraph
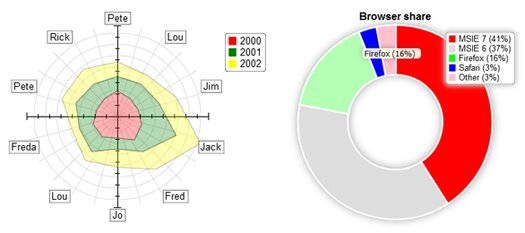
RGraph is an HTML5 graphs and charts library that uses Javascript and HTML5 to draw and supports over twenty different types of charts.
Using the new HTML5 canvas tag, RGraph creates these charts inside the web browser, meaning quicker pages and less web server load. This leads to smaller page sizes and faster websites.

RGraph is a versatile and fast HTML5 charting solution that supports many different types of charts. It’s easy to integrate into your website and extensively documented.
RGraph has lots of features, such as tooltips, visual effects, zooming, context menus, interactive adjusting and resizing to name a few.
Categories:
Tags:


Related Posts