May
Canvas Based Drawing and Animation Framework – jcotton
jcotton, a javascript framework that lets you draw and animate on html canvas. It contains a simple to read and write interface that allows properties and animations to be chained together.

jcotton offers animating a range from simple shapes to complex curved ones with text animation support. It works on all major browsers and also supports mobile browsers (limited fonts).
Categories:
May
Mind Mapping Web Application Built on HTML5 Canvas
Think is a free, interactive and handy mind mapping web application built on the HTML5 Canvas element, Django and Google App Engine.
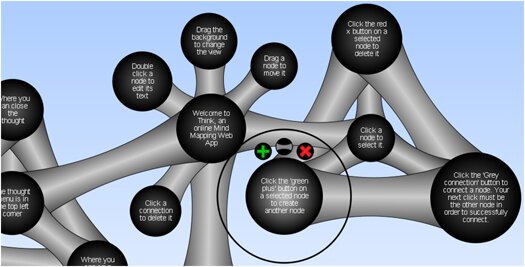
This HTML5 Canvas Application allows users to create and view their own mind maps. Think is a simple web application and easy to use:
- Click a node to genrate new node or connect with others
- Edit the node text
- Delete or modify a node’s connections
Categories:
Tags:
Apr
Create Image Slideshows with jQuery on HTML5 Canvas
Create image slideshows with smooth beautiful animations on HTML5 Canvas with jQuery Canvas Cycle Plugin.
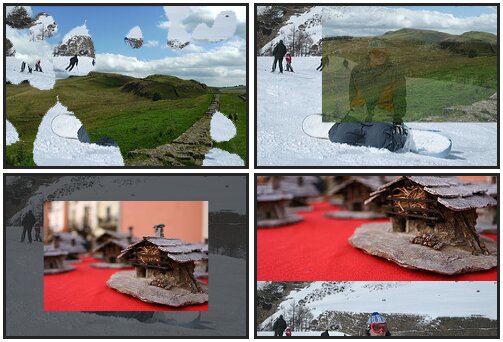
It’s very simple to implement and let users easily customize:
- Transition type & speed
- Animation effects like Fade, Masking, Zoom
If your browser does not support HTML5 Canvas tag, the text will be swapped by the browser.
As this is a newly born plugin so it does not provide as many options as we see all around for image slideshows but the good thing is; the developer has planned features like start / stop, paging etc. in near future.
Categories:
Apr
Create Vector Maps With HTML5 & Canvas – Cartegan
Cartegan is an open source HTML5 & Canvas based framework for creating and rendering vector maps, ideal for news channles, reporting agencies & GPS type navigation service providers.
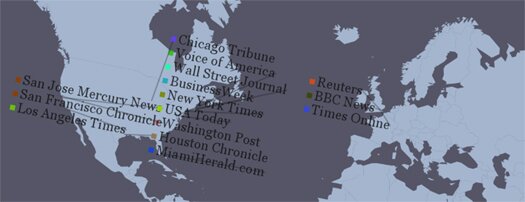
Cartagen draws maps dynamically on the client side and maps can:
- move
- adapt
- redraw
- and can include as many layers of data as needed
Vector mapping is done in native HTML 5 & styled wth GSS (cascading stylesheet specification for geospatial information). Maps created with this open source software use less bandwidth and can run easily on the iPhone and the Android platforms.
Categories:
Apr
Visualization Toolkit For Javascript Using Canvas – Protovis
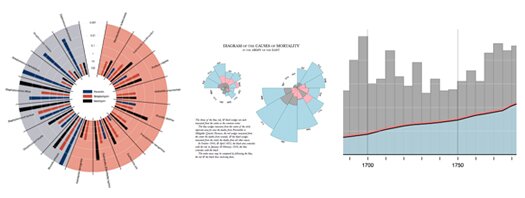
Protovis is a Visualization Toolkit for JavaScript using the canvas element. It takes a graphical approach to data visualization, composing custom views of data with simple graphical primitives like bars and dots. These primitives are called marks, and each mark encodes data visually through dynamic properties such as color and position.
Website: http://vis.stanford.edu/protovis/
Demo: http://vis.stanford.edu/protovis/ex/
Download: http://code.google.com/p/protovis-js/downloads/list
Categories:
Tags:
Categories:
Tags:
Jan
Pixastic – Open Source JavaScript Image Processing Library

Pixastic is a JavaScript library which allows you to perform a variety of operations, filters and fancy effects on images using just a bit of JavaScript.
Features:
- Desaturation/greyscale
- Invert
- Flipping
- Brightness/contrast adjustment
- Hue/saturation
- Emboss
- Blur & more…
Pixastic Photo Editor

Pixastic is also an experimental online photo editor that incorporates some of the same techniques used in the library to create an image manipulation application. Most of the effects found in the library can be seen in action here, as well as other simple editing features.
Pixaxtic Website: http://www.pixastic.com/
Pixastic Photo Editor: http://editor.pixastic.com/
Categories:
Tags:
Dec
JavaScript Image Processing Library: Pixastic
Pixastic is an open source JavaScript image processing library.
It uses HTML5 Canvas element that enables accessing to raw pixel data.

Supported effects are:
- desaturation/greyscale
- invert
- flipping
- brightness/contrast adjustment
- hue/saturation
- emboss
- blur & more
There is an image editor built with it & the library is well-documented.
Compatibility: All Major Browsers (IE requires ExCanvas)
Website: http://www.pixastic.com/
Categories:


