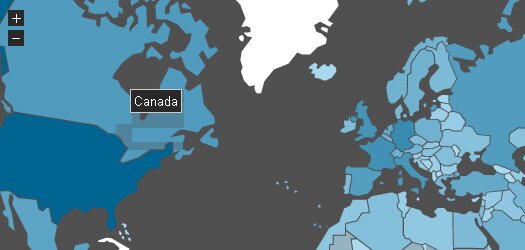
Challenged with graphical illustration of geographical data? Try simple and interactive geographical heat maps designed with jVectorMap.
jVectorMap is a jQuery plugin for creating vector maps and data visualization on HTML pages. This simple plugin can be used for many other purposes; heat maps, data visualization, interactive maps being just a few examples.

jVectorMap uses SVG to provide compatibility with all modern browsers including Firefox 3 or 4, Safari, Chrome, Opera, IE9, while legacy support for older versions of IE from 6 to 8 is provided with VML.


