


Data visualization is the study of the visual representation of data, meaning “information that has been abstracted in some schematic form, including attributes or variables for the units of information”.
Data Visualization Tools can help you easily create infographics, charts, graphs, interactive data visualizations, and motion graphics.
This is not a list of everything out there, but instead a thoughtfully curated selection of best tools that will make your life easier creating meaningful and beautiful data visualizations (charts, graphs or maps).
From simple charts to complex maps and infographics, these 50+ tools have everything you need to bring your data to life.
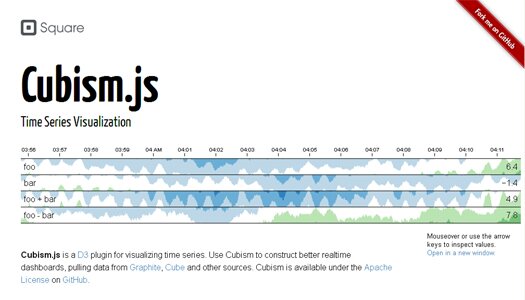
A JavaScript Library for Time Series Visualization: Cubism.js
Create Animated Visualisations with Flot jQuery plugin

Easily Work with Vector Graphics on the Web: Raphael JS

Free HTML5 and JavaScript Charts: RGraph

Integrate / Develop Interactive Maps within Your Site: Modest Maps

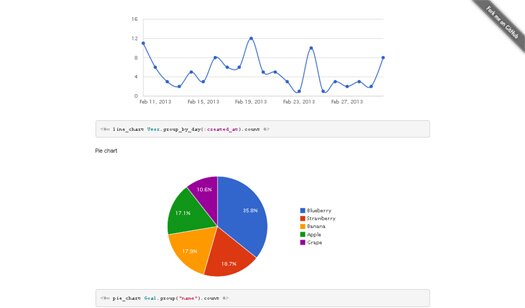
Charts With A Single Line Of Ruby: Chartkick
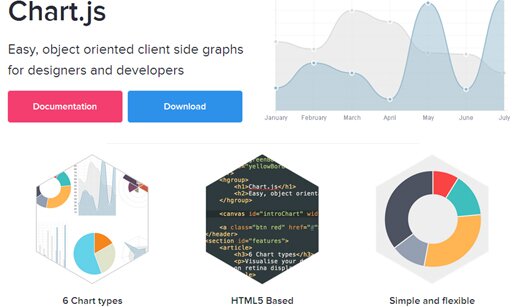
Standalone Charting Library With HTML5 Canvas: Chart.js
A jQuery Component For Gantt Charts & Task Trees: Teamwork Gantt

JavaScript Charts With SVG: xCharts

A JavaScript Sparklines Library: Sparky

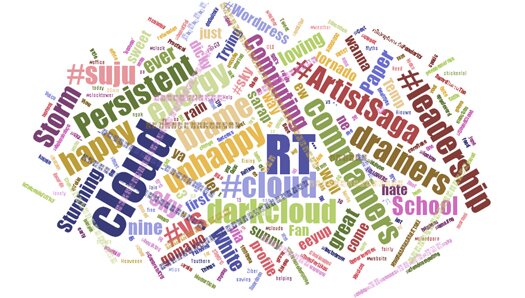
Wordle-Like Word Clouds With JavaScript: D3-Cloud
Easily Embed Interactive Networks in your Website: Cytoscape Web

Open Source JavaScript Library to Draw Graphs: SigmaJS

Make Pretty Graphs with JavaScript: TufteGraph

SVG Graphics Library For JavaScript: jsDraw2DX

Gantt Charts With PHP – Gantti

Interactive & Re-Usable Charts With D3.js: NVD3.js

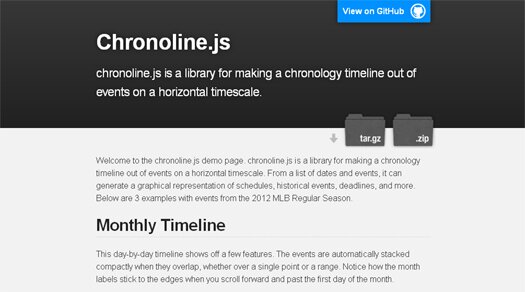
A JavaScript Library For Displaying Timeline Of Events: Chronoline.js
Convert your HTML Data Tables into Fancy Highcharts Graphs: jQuery HighchartsTable

Web Widget for Plotting Time Series: Timeplot

Pretty Time-series Line Graphs: Morris JS

A Library For Interactive HTML5 Visualizations: Envision.js

Open Source HTML5 Charts & Graphs: Flotr2

A JavaScript Toolkit For Interactive & Real-Time Graphs: Rickshaw

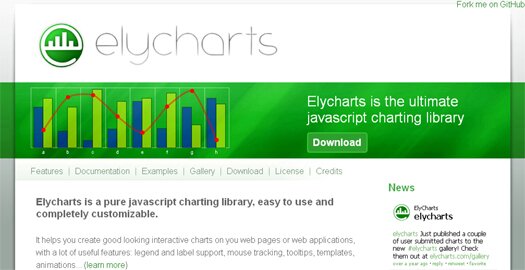
Free JavaScript Charting Library: Elycharts
Free JavaScript Diagramming Library: JointJS

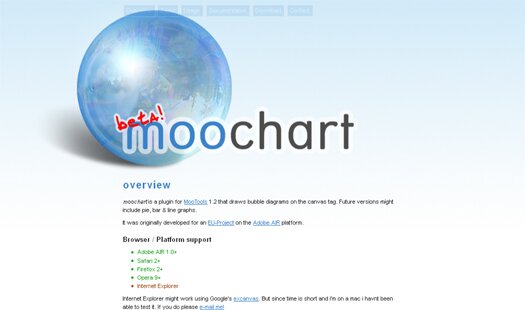
MooTools Library to Draw Bubble Diagrams/Charts With Canvas: Moochart
Graphing library for MooTools: MilkChart

Wheel-Like Data Visualization With MooWheel

A Simple to use JavaScript Graphing Library: Scheming Cow graphics

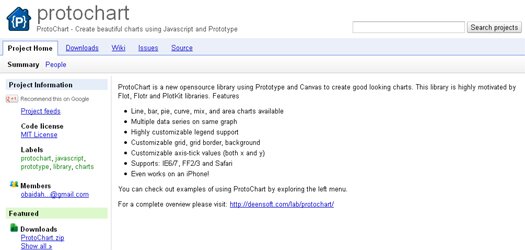
Create Beautiful Charts using Javascript and Prototype: ProtoChart
Tiny Charts (Sparklines) With jQuery: Peity

JavaScript graph library based on Raphaël

Grafico JavaScript Charting Library

Charts with JavaScript and The Ccanvas Element: AwesomeChartJS

Chart and Graph Plotting Library for JavaScript: PlotKit

Graph Visualization Library With Web Workers & jQuery: Arbor.js

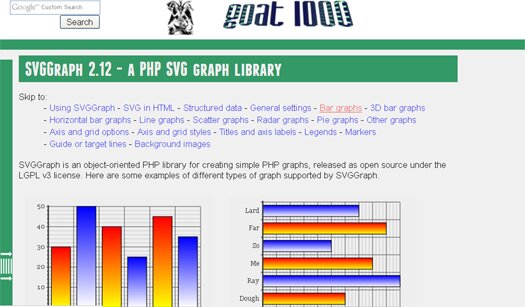
A PHP SVG Graph Library: SVGGraph
Impressive Canvas Graphing Library: canvasXpress

Drill-Down Bar Charts With jQuery: DDChart

Google Finance-Like Charts With JavaScript: HumbleFinance

Powerful PHP Charts Library: JpGraph

Powerful HTML5 Graph Library: RGraph

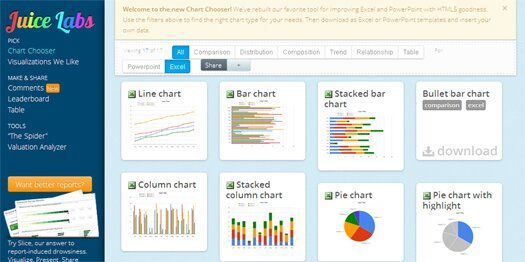
Beautiful Free Charts For Excel & Powerpoint
JavaScript Data Visualization Toolkit: InfoVis

Free, Open Source Asp.Net Diagram Control: EasyDiagram.NET

Create Web Wirable Interfaces for Dataflow Applications: WireIt

Free Flash Charts From FusionCharts

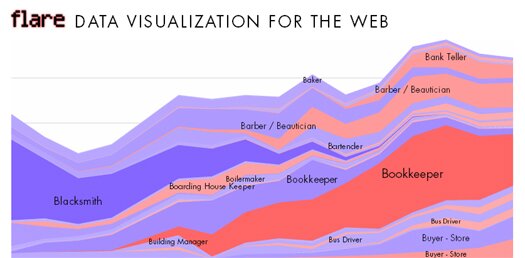
Flash Data Visualization Library: Flare
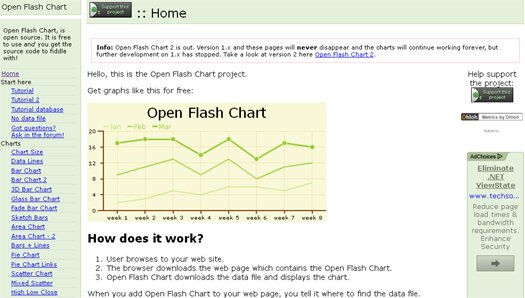
Free Flash Chart Library: Open Flash Chart
Open Source PHP Chart Library: pChart

PHP Class For Google Charts API: GoogChart

Charts On The Fly With Google Charts API
